

Updated: July 30, 2026
OPRS may receive compensation when readers open an account through partner links on this page. Our analysis is based on independent research, BBB data, and IRS publications.
30-second verdict
- The reason to diversify with precious metals is correlation, not return. Gold and the S&P 500 have moved on a near-zero 50-year correlation, so a small gold sleeve tends to cushion equity drawdowns in inflation-led crises.
- The size of the sleeve sits in a 5 to 15 percent band for most US retirement portfolios, per the published asset-allocation research. Below 5 percent the diversification benefit is too small to matter. Above 15 percent the opportunity cost on real return begins to dominate.
- The wrapper choice is structural. Physical gold or precious-metal ETFs in a taxable account hit the 28 percent collectibles long-term capital gains ceiling under IRC Section 1(h)(5). A self-directed gold IRA shelters the same metal under standard IRA rules.
- The load-bearing decision is the dealer on the IRA side. The custodian and depository are commodities; the dealer is where spread opacity and high-pressure sales practices live. Most BBB complaints in this category trace back to the dealer step.
Most retirees holding a 401(k), a traditional IRA, or a Roth IRA are concentrated in equities. The default target-date fund glide path is heavy on stocks for 30 years, with a bond slope as retirement nears. That structure has carried real-return growth for the accumulation phase.
It also leaves the portfolio exposed to two distinct downside scenarios. The first is an equity bear market (2000, 2008, 2020). The second is an inflation cycle that hurts both stocks and bonds at the same time (1973 to 1980, 2022).
our 2026 shortlist of vetted gold IRA dealers before any opening call on the gold IRA side. The diversification thesis is straightforward; the implementation is where most retirees get the dealer choice wrong, and that single decision drives most BBB complaints in the category.
This page maps the case for a precious metals allocation across five lenses. Section I covers why a single-asset retirement portfolio under-performs across full cycles. Section II covers what gold actually contributes (correlation and inflation behavior, not return).
Section III sizes the sleeve against the published research. Section IV stacks the three historical crises where the sleeve mattered. Section V addresses the wrapper question and the IRC Section 1(h)(5) collectibles ceiling that pushes the metal into an IRA.
Screen the dealer before any gold IRA opening call
The portfolio decision (whether to add a precious metals sleeve, and how big) is one question. The execution decision (which dealer carries that sleeve at a clean spread) is a separate question with its own failure modes. A thin or opaque dealer at the opening step is the source of most complaints OPRS sees in BBB filings on this category. Run the dealer screen before any conversation about funding.
3 of 27+ gold IRA dealers reviewed by OPRS make the 2026 trusted list. Updated July 2026.
Why a single-asset retirement portfolio fails across full cycles
The base case for any diversification argument starts with what a single-asset portfolio actually does over time. The US stock market has delivered roughly 10 percent nominal per year from 1928 through 2024, per the NYU Stern Damodaran historical returns dataset. After CPI, the real number is closer to 6.5 to 7 percent per year. That is the long-run engine of retirement wealth.
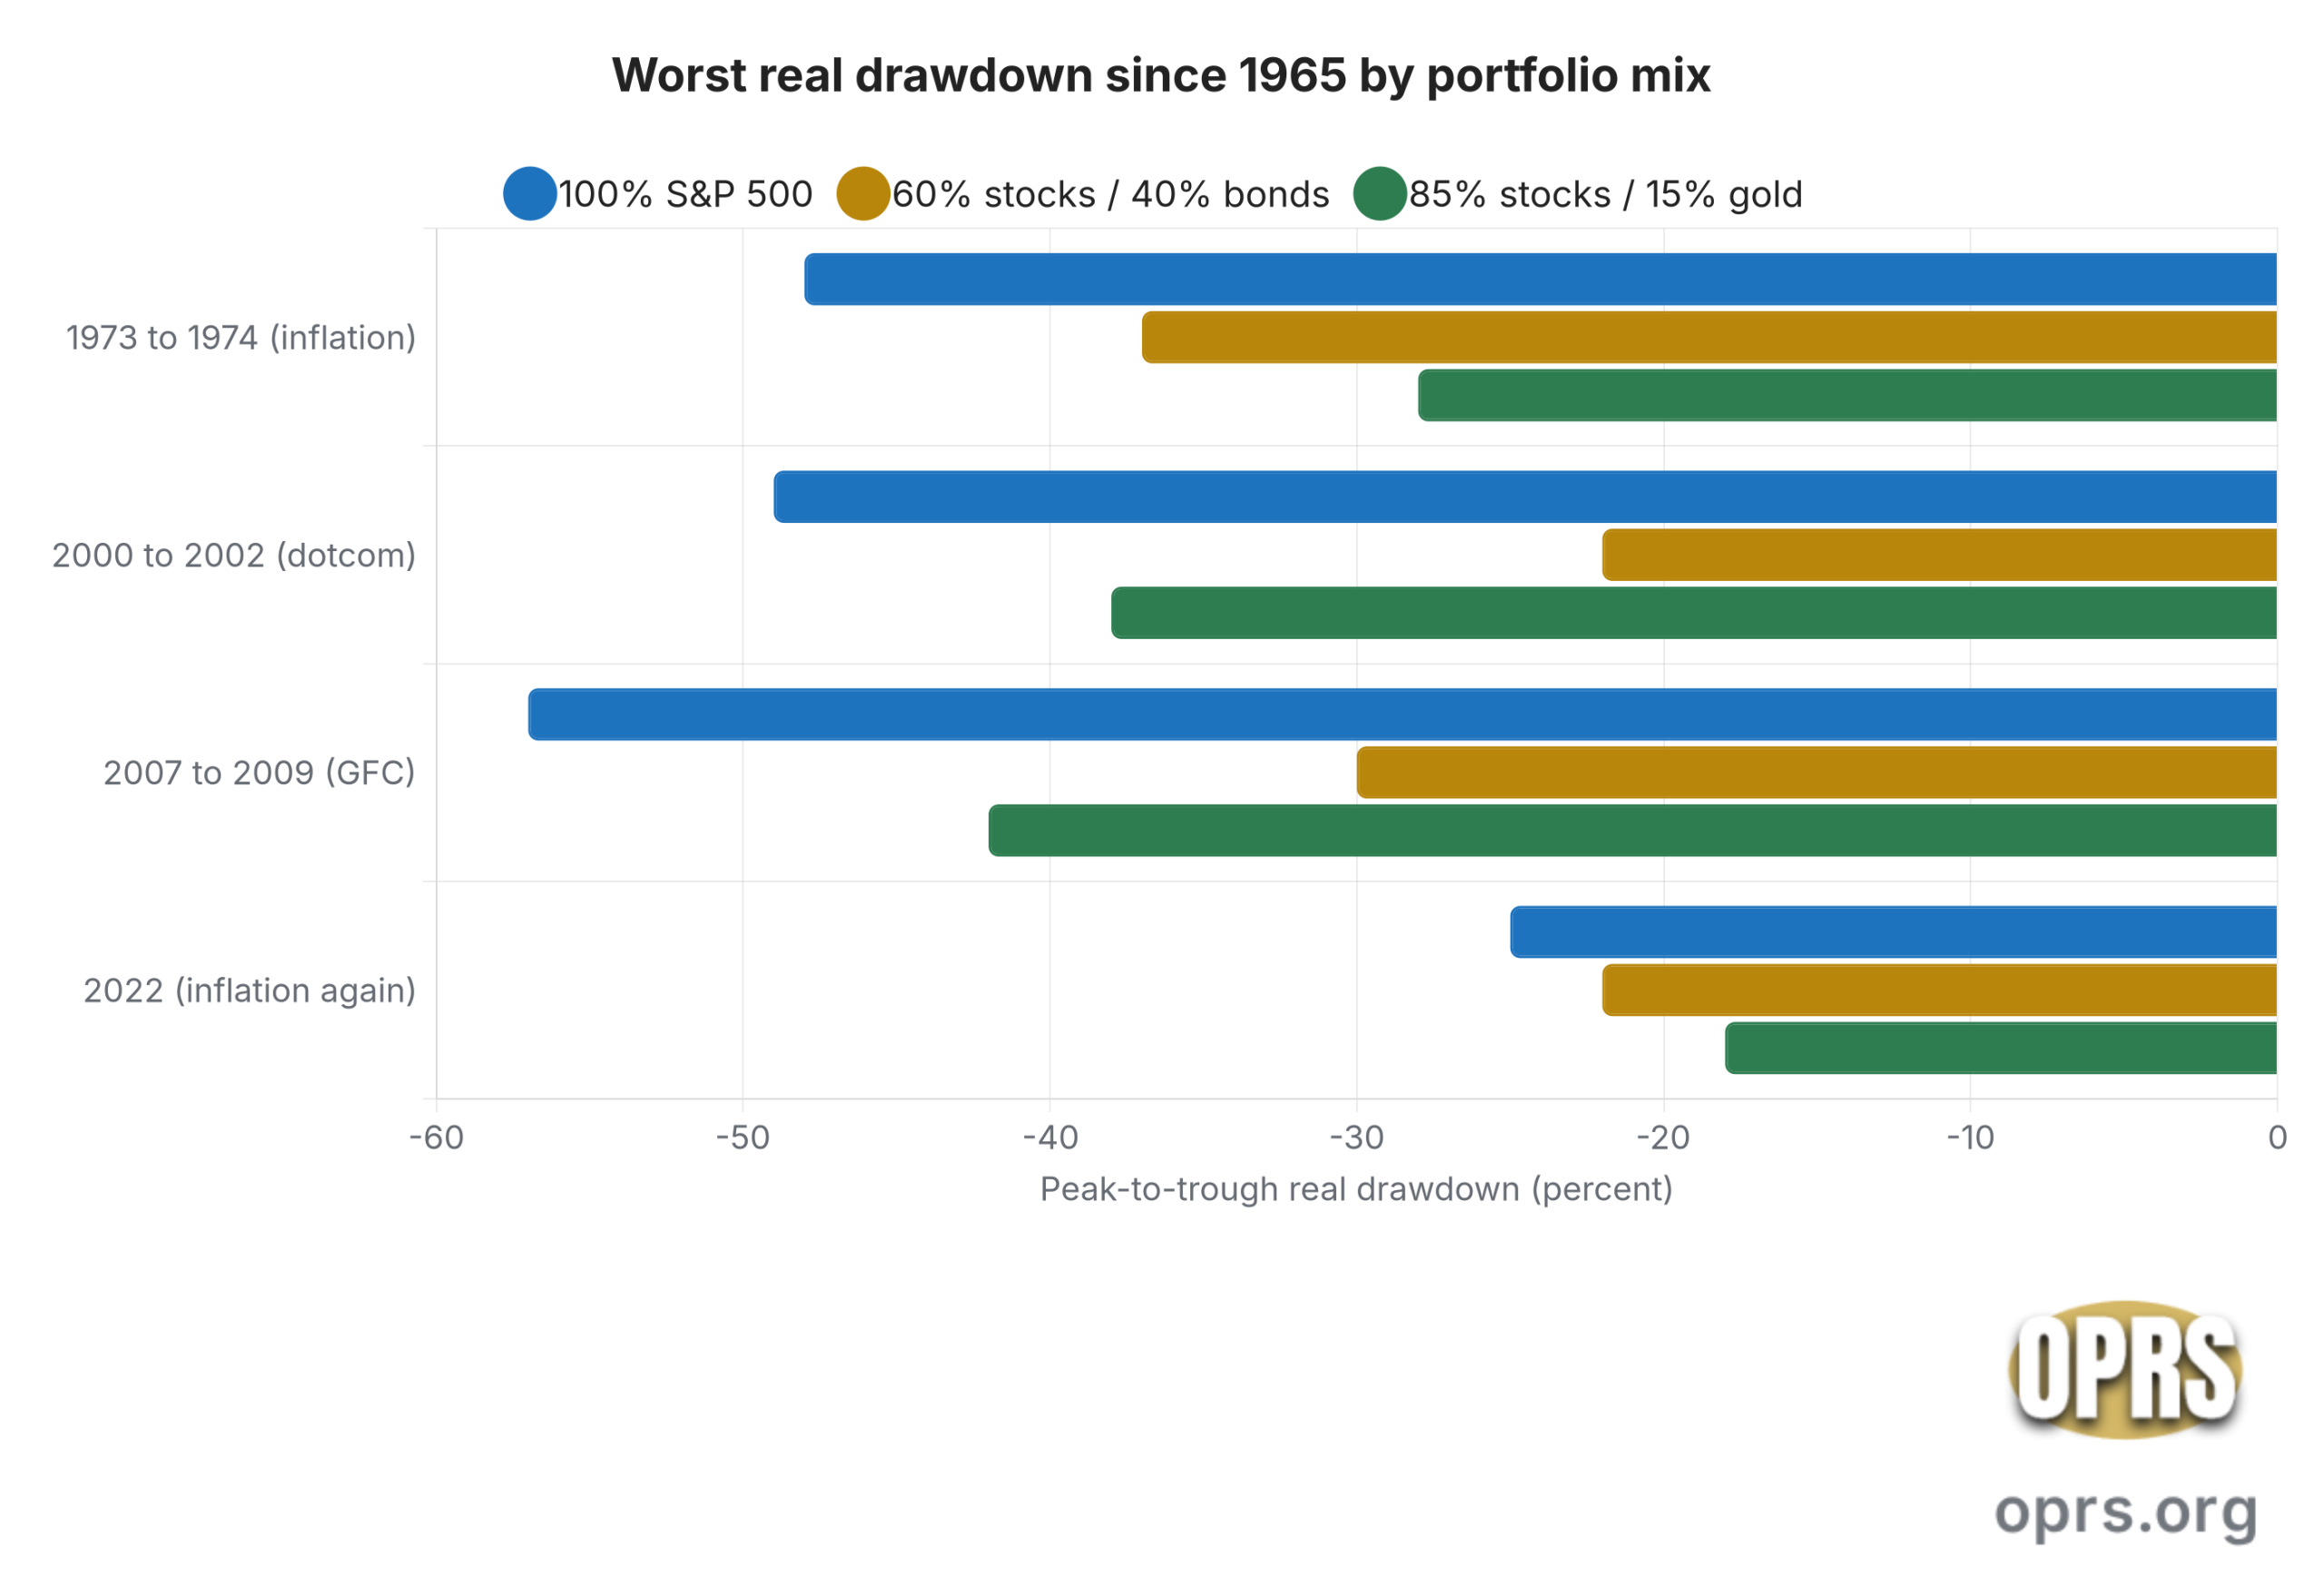
The structural counterweight on that engine is drawdown. The S&P 500 has lost more than 30 percent peak-to-trough on multiple occasions. Examples include 1929 to 1932 (roughly minus 86 percent), 1973 to 1974 (minus 48 percent real), 2000 to 2002 (minus 49 percent), 2007 to 2009 (minus 57 percent), and March 2020 (minus 34 percent in 33 days). A retiree drawing down a stock-only portfolio during one of these events faces sequence-of-returns risk.
Sequence-of-returns risk is the asymmetry between early-retirement years and late-retirement years. A 30 percent drawdown in year 1 of retirement, combined with 4 percent annual withdrawals, can shorten the portfolio runway by a decade compared with the same drawdown in year 20. The published research on safe withdrawal rates (Bengen 1994 and later work) is calibrated around this asymmetry.
The classical answer to that asymmetry is a bond sleeve. A 60/40 stock-bond portfolio cushioned the 2000 and 2008 equity crashes. It failed in 2022, when bonds and stocks fell together for the first time in four decades. A retiree on a 60/40 glide path lost roughly 22 percent of real value in 2022 in a single calendar year. The diversification benefit of a bond sleeve depends on bonds and stocks moving on different beats, which the 2022 cycle broke.
Precious metals enter the picture as a different kind of sleeve. The 50-year correlation between gold and the S&P 500 is close to zero, per the World Gold Council asset allocation studies. The 50-year correlation between gold and US 10-year Treasuries is also close to zero. That low-correlation profile is the entire structural argument for the sleeve. It is not a directional bet on a crisis. It is a portfolio-level reduction of drawdown.
What precious metals actually contribute to a retirement portfolio
The most common misreading of the diversification case is to frame gold as a return engine. Long-run real returns on gold sit around 1 to 2 percent per year, against 6.5 to 7 percent real for stocks. A 100 percent gold portfolio would not have funded a 30-year retirement at 4 percent withdrawals. A 100 percent stock portfolio would have, with sequence-of-returns risk on top.
The contribution is portfolio-level, not asset-level. A small gold sleeve added to a stock-heavy core shows up in three measurable ways. First, the portfolio’s worst peak-to-trough drawdown shrinks. Second, the portfolio’s recovery time after a major drawdown shortens. Third, the portfolio’s annualized real return gives up a fraction of a percent, in exchange for those two improvements.
The mechanism is straightforward. Gold has tended to rally during inflation-led crises (1973 to 1980, 2008 to 2011, 2020 to 2022) while equities lost real value. It has also tended to hold its value during currency events that hit Treasuries (the early 1980s, the late 2010s dollar weakness). It does not protect against deflationary equity crashes the way Treasuries do; it is not a substitute for the bond sleeve.
Silver, platinum, and palladium share much of gold’s low-equity-correlation profile but with higher volatility and a meaningful industrial-demand component. The IRS-approved precious metals list under IRC Section 408(m) includes specific bullion grades of all four metals. Most retirement portfolios that use a precious metals sleeve weight it heavily toward gold for the lower volatility, with a smaller silver position as a higher-beta diversifier within the sleeve.
How much: the 5 to 15 percent allocation band
The published asset-allocation literature has converged on a narrow band for gold in a US retirement portfolio. Erb and Harvey 2013 (Journal of Portfolio Management) modeled gold allocations between 0 and 25 percent across multiple regime assumptions. The World Gold Council’s asset allocation research, updated annually, models 0 to 20 percent. The Ibbotson commodity allocation studies model 5 to 15 percent. The clustering is consistent: most credible models land in a 5 to 15 percent range.
Below 5 percent, the gold sleeve is too small to move portfolio-level drawdown numbers in any meaningful way. The diversification benefit is real but financially trivial. Above 15 percent, the opportunity cost on long-run real return becomes the dominant effect. A 25 percent gold allocation over 30 years gives up roughly 1.5 percent of annualized real return against a 100 percent stock baseline, which compounds to a materially smaller terminal balance.
The figure below shows what the trade-off looks like in concrete drawdown numbers. The chart stacks worst real peak-to-trough drawdowns since 1965 for three retirement portfolio configurations: 100 percent S&P 500, 60/40 stock-bond, and 85/15 stock-gold. The 85/15 mix is the canonical diversified-core-plus-gold-sleeve portfolio in the published research.
Precious metals IRA fee-drag calculator
Precious metals IRAs charge mostly flat dollar fees (setup, annual custodian, storage). Flat fees take a much bigger bite out of a small account than a large one. Enter your numbers to see the drag.
Estimate only. Fee amounts vary by provider and are often not published; enter figures you confirm in writing. This tool ignores metal price changes and the dealer spread, which also affect returns. Not financial advice.
The right dealer explains every fee up front. Get Augusta's free precious metals IRA company checklist.
The pattern is clean. The 100 percent stocks line is the floor of long-run real return and the ceiling of drawdown pain. The 60/40 line cushioned 2008 but failed in 2022 when bonds and stocks fell together. The 85/15 stock-gold line cushioned 1973 to 1980 (inflation), 2008 (financial crisis), and 2020 to 2022 (inflation again) without trading away most of the equity engine. The 15 percent gold sleeve does not eliminate drawdowns; it softens them.
The exact allocation inside the 5 to 15 percent band depends on age, risk tolerance, and current portfolio composition. A 65-year-old retiree drawing down a 401(k) might run 10 to 15 percent gold for the sequence-of-returns protection. A 50-year-old accumulator might run 5 to 10 percent. A 35-year-old with a 30-year horizon might skip the sleeve entirely and concentrate in equities for the higher long-run real return.
The three crises where the gold sleeve mattered
The portfolio case for a precious metals allocation is anchored in three specific historical episodes. Each was an inflation-led crisis where the conventional stock-and-bond portfolio lost real value at the same time. Each was a regime where the gold sleeve carried part of the load. These are the working numbers a plan should anchor to, not promises about the next cycle.
1973 to 1980: stagflation. The S&P 500 lost roughly 48 percent in real terms peak-to-trough during the 1973 to 1974 bear market. It underperformed inflation for most of the decade. Gold rose from about 35 dollars per ounce in 1971 to over 800 dollars per ounce in January 1980, per US Treasury historical gold price data.
A retiree drawing down a stock-only portfolio during this stretch faced severe sequence-of-returns risk. A retiree with a 10 to 15 percent gold sleeve preserved real purchasing power.
2007 to 2011: financial crisis and recovery. The S&P 500 fell 57 percent peak-to-trough between October 2007 and March 2009. Gold rose from about 700 dollars per ounce in October 2007 to over 1,900 dollars per ounce in September 2011. A 60/40 portfolio cushioned the 2008 drawdown but recovered slowly. An 85/15 stock-gold portfolio cushioned the drawdown to roughly minus 42 percent and recovered faster as gold continued to rally into 2011.
2020 to 2022: pandemic, inflation, dual decline. The S&P 500 fell 34 percent in 33 days during the March 2020 pandemic crash. It recovered, then fell again 25 percent in real terms during the 2022 inflation cycle.
The 60/40 portfolio lost roughly 22 percent of real value in 2022 alone, as bonds and stocks fell together for the first time in four decades. Gold ended 2022 close to flat in dollar terms while delivering positive real returns relative to the broader stock-bond complex.
The future will not look exactly like any of these episodes. The case for the sleeve does not depend on it doing so. It depends on the low correlation persisting through regime changes, which is what the 50-year record supports. Check this dealer against the 2026 OPRS list before opening any account that holds the metal, because the execution risk dwarfs the strategic risk on a 5 to 15 percent allocation.
Why the IRA wrapper, not a taxable account
The wrapper choice is the most overlooked piece of the diversification decision. Physical gold and silver in a taxable brokerage account, including precious-metal ETFs structured as grantor trusts (GLD, SLV, IAU), face a structural federal tax penalty. Long-term capital gains on collectibles are taxed at a maximum 28 percent rate under IRC Section 1(h)(5), well above the 15 or 20 percent rate that applies to long-term gains on stocks.
The IRA wrapper neutralizes that penalty. A traditional gold IRA defers tax until distribution, at which point the investor pays ordinary marginal rates (commonly 22 or 24 percent for a typical retiree). A Roth gold IRA pays zero federal tax on a qualified distribution after age 59 and a half and the 5-year clock, per IRS Publication 590-B. The same metal in the same depository, sheltered in two structurally different ways.

The figure above models the federal tax owed on a 50,000 dollar long-term gain across five wrapper choices. Stocks in taxable cap at 20 percent LTCG, per IRS Topic 409. Gold in taxable hits the 28 percent collectibles ceiling. A traditional gold IRA pays ordinary rate at distribution. A Roth gold IRA on a qualified distribution pays zero.
The wedge between the worst case (14,000 dollars in tax on the taxable gold gain) and the best case (zero on the qualified Roth distribution) is the entire structural argument for the IRA wrapper on a gold sleeve.
The cost stack on a self-directed gold IRA has three layers. A one-time dealer spread of 3 to 6 percent is paid at acquisition on IRS-approved coins and bars. The annual custodian fee runs about 80 to 150 dollars. The annual depository storage fee runs about 100 to 200 dollars on a five-figure to low-six-figure position.
The three layers together amortize favorably against the tax wedge above 25,000 to 50,000 dollars in sleeve size. Below that, an IAU position inside a brokerage IRA is the cheaper path.
The four common diversification mistakes
Most failures in implementing a precious metals allocation are not failures of the thesis. They are failures of execution. Four recurring mistakes show up across the BBB and CFTC complaint record on this category.
- Mistake 1: treating gold as a return engine. The sleeve is sized for correlation, not return. A retiree who allocates 40 or 50 percent to gold expecting equity-like real growth gives up most of the long-run engine. The published research clusters at 5 to 15 percent for a reason.
- Mistake 2: buying high-premium proof or rare coins instead of bullion. Proof and “rare” coin upsells routinely carry 20 to 50 percent spreads over melt value. They are not IRS-approved IRA metal under IRC Section 408(m) unless they meet specific bullion grades. The 3 to 6 percent spread on standard IRA-eligible bullion is the recoverable lever; the proof-coin spread is not.
- Mistake 3: holding the metal in a taxable account. A gold ETF or physical position in taxable hits the 28 percent collectibles ceiling. A retiree with rollover-ready 401(k) or IRA dollars who buys gold in taxable instead is leaving 8 to 28 percentage points of tax on the table at sale.
- Mistake 4: choosing the dealer last instead of first. The custodian and depository are commoditized at this point in the market. The dealer is where spread opacity, pressure tactics, and BBB complaint volume live. Most retirees evaluate dealers after they have already decided to fund. The correct sequence is the inverse: see the dealers OPRS clears and the ones we warn against before any opening call.
Who should not pursue a precious metals allocation
Three retiree profiles should not put fresh dollars into a precious metals sleeve at this stage. Each represents a different structural mismatch with what the sleeve does.
The first is the saver under 25,000 dollars in total retirement balance. The 200 to 300 dollar annual custodian-plus-storage fee stack is a meaningful drag on a small balance. The 3 to 6 percent dealer spread compounds the drag. A 100 percent low-cost stock index fund inside a Roth IRA is the right answer at this size. Revisit the gold sleeve when the balance crosses 50,000 dollars or a rollover catalyst arrives.
The second is the saver carrying high-interest debt (credit card balances above 8 percent APR, payday loans). Eliminating an 18 percent APR balance locks in an 18 percent yield, which neither stocks nor gold reliably matches on a risk-adjusted basis over short windows. Pay down the debt first.
The third is the saver pitched a “home storage gold IRA” or “checkbook LLC gold IRA” scheme. Neither structure complies with IRC Section 408(m). The US Tax Court ruled on this in McNulty v. Commissioner, T.C. Memo 2021-129.
Physical possession of IRA-titled coins by the IRA owner is treated as a deemed distribution of the full IRA balance, plus a 10 percent penalty if the owner is under 59 and a half. Walk away from any sales conversation that proposes this structure, regardless of how it is labeled.
Frequently asked questions
Is gold a good investment for retirement?
“Good investment” is the wrong frame. Gold is a low-correlation diversifier inside a stock-and-bond retirement portfolio, not a standalone return engine. The published asset-allocation research supports a 5 to 15 percent allocation for most US retirement portfolios. Above that band the opportunity cost on long-run real return becomes the dominant effect, against a 6.5 to 7 percent real for the equity sleeve.
How much of my retirement should be in precious metals?
The published research (World Gold Council asset allocation studies, Erb and Harvey 2013, Ibbotson commodity allocation work) clusters at 5 to 15 percent of a US retirement portfolio. The exact figure inside that band depends on age, current portfolio composition, and inflation outlook. A 65-year-old retiree drawing down a 401(k) typically sits at 10 to 15 percent for sequence-of-returns protection. A 50-year-old accumulator typically sits at 5 to 10 percent.
Does precious metals diversification protect against a market crash?
Historically gold has rallied during inflation-led crises (1973 to 1980, 2008 to 2011, 2020 to 2022) and has been roughly flat during deflation-led crashes. Past performance is not a forecast. The portfolio-level effect is the relevant lens. A 100 percent stocks portfolio in 2008 fell minus 57 percent peak-to-trough. The same portfolio with an 85/15 stock-gold split fell about minus 42 percent. The 15 percent sleeve did not eliminate the crash; it softened it by about 15 percentage points.
Why use a self-directed gold IRA instead of a gold ETF in a regular IRA?
Both wrappers shelter gold from the 28 percent collectibles ceiling. The choice is a balance-size question. For sleeves under 25,000 dollars, IAU or GLD inside a mainstream brokerage IRA is the lowest-overhead path (0.25 to 0.40 percent expense ratio, no custodian or depository fees). For sleeves above 50,000 dollars, a self-directed gold IRA that holds IRS-approved physical bullion can be cost-competitive on a 20 to 30 year horizon, given the absence of an annual expense ratio at the trust level.
What metals are IRS-approved for a self-directed precious metals IRA?
IRC Section 408(m) sets the purity floors: 99.5 percent for gold, 99.9 percent for silver, 99.95 percent for platinum and palladium. Specific bullion coins (American Gold Eagle, American Silver Eagle, Canadian Gold Maple Leaf, certain bars from approved refiners) qualify. Proof coins and “rare” or “numismatic” coins generally do not, even when sold by gold IRA dealers as if they did. The dealer’s claim is not the test; the IRS rule is.
Can I take physical possession of the metal in my gold IRA?
Not before a qualifying distribution. IRC Section 408(m) requires IRA-held precious metals to sit at an IRS-approved third-party depository. Physical possession by the IRA owner before a qualifying distribution is treated as a deemed distribution of the entire IRA balance, per the McNulty v. Commissioner ruling (T.C. Memo 2021-129). At distribution, the investor can take cash or in-kind delivery of the metal, subject to standard ordinary-income tax for a traditional IRA.
If the case above points toward adding a 5 to 15 percent precious metals sleeve to a stock-heavy retirement portfolio, the load-bearing decision is the dealer on the IRA side. The strategic decision (whether to diversify, and how big) is the easy part. The execution decision (which dealer carries the sleeve at a clean spread, with verifiable custody, and without high-pressure sales practices) is where most of the operational risk lives.
OPRS reviews dealers against a published checklist drawn from IRC Section 408(m) compliance, BBB public records, and CFTC enforcement history. See the 2026 OPRS dealer list for the operators we currently warn against and the names we have cleared.
Augusta Precious Metals is one of the dealers on the cleared list. Its Education-First process (Learn, Talk, Decide) walks every prospect through the IRC Section 408(m) mechanics before any funding conversation. Augusta carries BBB A+ accreditation since 2014 with no complaints on file.
Augusta has been recognized as Money Magazine’s Best Overall Gold IRA Company every year from 2022 through 2026, and as Investopedia’s Most Transparent Gold IRA Company 2022 through 2026. Augusta’s industry-reported minimum sits around 50,000 dollars in transferable retirement balance, which keeps it out of the under-25,000 dollar profile flagged above.
Sources cited
- IRC Section 408(m): Investment in collectibles treated as distributions (purity and storage rules for IRA-eligible precious metals)
- IRC Section 1(h)(5): Maximum 28 percent capital gains rate for collectibles
- IRC Section 4975: Prohibited transactions and disqualified persons
- IRS Publication 590-A: Contributions to Individual Retirement Arrangements (IRAs)
- IRS Publication 590-B: Distributions from Individual Retirement Arrangements (IRAs)
- IRS Topic 409: Capital Gains and Losses (long-term capital gains brackets for stocks)
- FINRA Investor Insights: Precious Metals Investments
- SEC investor.gov: Mutual Funds and Exchange-Traded Funds (ETFs)
- CFTC Investor Advisory: Precious Metals Fraud