

Updated: August 16, 2026
OPRS may receive compensation when readers open an account through partner links on this page. Our analysis is based on independent research, BBB data, and IRS publications.
A retiree who understands the 4 percent rule reaches the same follow-up question every time. Which alternative method actually delivers a better retirement? The honest answer is that the five most-cited methods trade different things. This page compares them on the same terms so the trade-offs are visible at design time, not year six.
The five methods below are the ones that show up in the academic literature and in serious planning software. Each one starts from a different premise. Each one asks the retiree to accept a different flavor of risk. None of them is universally better. The right choice depends on the household’s income floor, tolerance for a variable paycheck, and behavioral discipline.
Method 1: constant real withdrawals (Bengen 4 percent)
William Bengen’s 1994 paper in the Journal of Financial Planning defined the modern safe-withdrawal-rate framework. The rule takes 4 percent of the day-one portfolio and adjusts the dollar amount for inflation each year after. The portfolio balance is irrelevant to the withdrawal size once year one is set.
The appeal is a stable real paycheck. The cost is a rigid rule that ignores information. A retiree who watches the portfolio double still takes the same real dollars. A retiree whose portfolio falls in half still takes the same real dollars until it exhausts.
Method 2: constant percentage of current portfolio
The constant-percentage method takes a fixed share (commonly 4 percent) of whatever the portfolio is worth on the withdrawal date each year. The dollar amount rises when the portfolio rises and falls when it falls. The portfolio itself cannot exhaust in a mathematical sense because every draw is proportional.
The appeal is that portfolio survival is guaranteed by construction. The cost is a paycheck that swings with the market. A 30 percent equity drop translates directly into a 30 percent income cut in the following year. Households with fixed expenses find that difficult to absorb without a spending floor from Social Security or a pension.
Method 3: RMD-based withdrawals (IRS Uniform Lifetime Table)
The RMD-based method uses the IRS Uniform Lifetime Table divisor for the retiree’s age, applied to the prior-year-end portfolio value. The Uniform Lifetime Table is the same one that governs Required Minimum Distributions from traditional IRAs and 401(k)s, published in IRS Publication 590-B.
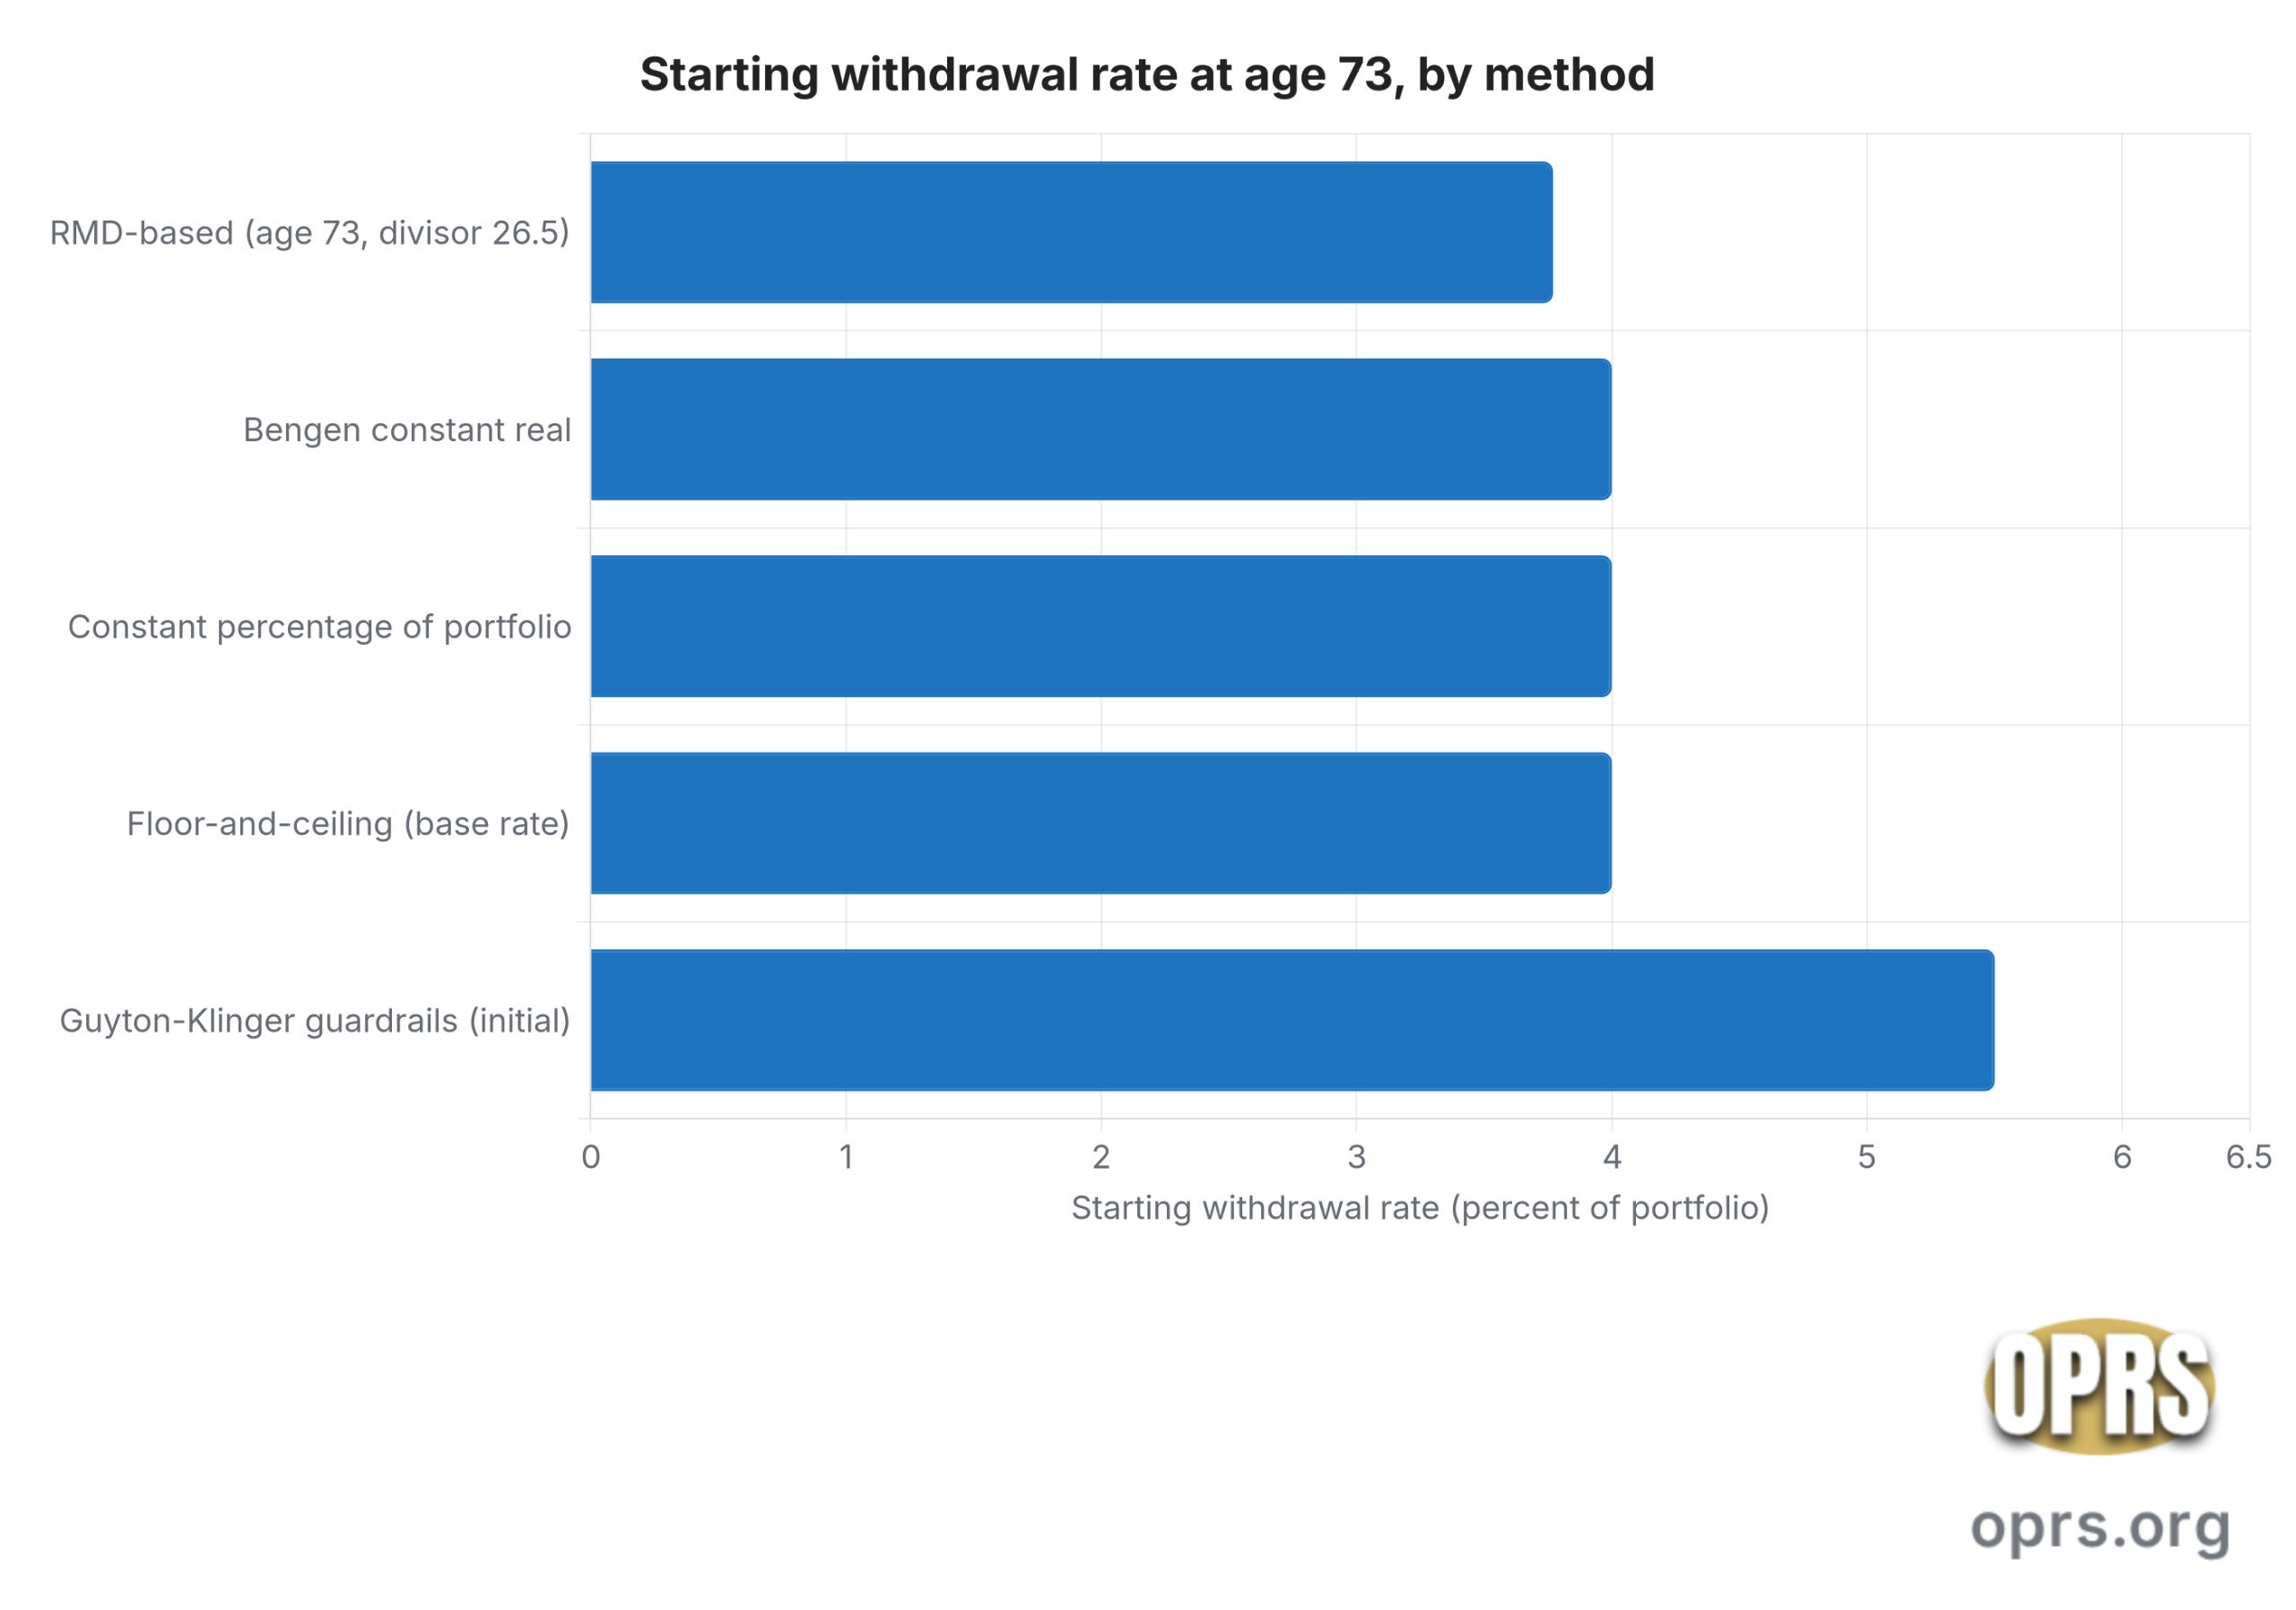
At age 73 the divisor is 26.5, which gives a starting withdrawal rate of 3.77 percent. At age 80 the divisor is 20.2, or 4.95 percent. The rate rises with age by design, so income scales upward as the horizon shortens. Mathematically the portfolio cannot exhaust because each divisor is finite.
The appeal is arithmetic simplicity and alignment with rules the retiree already follows for tax-deferred accounts. The cost is a starting rate below 4 percent for younger retirees, which can feel meager for a household that retired at 62 or 65.
Method 4: guardrails (Guyton-Klinger)
Jonathan Guyton and William Klinger published the guardrails method in the Journal of Financial Planning in 2006. The framework starts at a higher initial rate (often 5.0 to 5.5 percent) and adds four decision rules. Two of the rules matter most in practice.
The capital-preservation rule cuts the annual withdrawal by 10 percent whenever the current withdrawal rate rises more than 20 percent above the initial rate. The prosperity rule raises the withdrawal by 10 percent whenever the current rate falls more than 20 percent below the initial rate. The full rule set is decoded on the Guyton-Klinger guardrails method reference.
The appeal is a higher starting income while still responding to bad markets. The cost is that the retiree must actually execute the cut in a losing year, which is where behavioral discipline meets a Thanksgiving conversation.
Method 5: floor-and-ceiling
The floor-and-ceiling method takes a percentage of the current portfolio each year (typically 4 to 5 percent) and clips the result inside a corridor. The floor is a minimum real spending level the household will not fall below. The ceiling is a maximum the household will not draw above even in a boom.
The appeal is a bounded paycheck that a household can budget around. The cost is that in a deep bear market the floor forces a higher percentage withdrawal, which raises the odds the portfolio depletes. The method is a practical hybrid, not a mathematical guarantee.
Starting withdrawal rates on one chart
The differences show up first in the starting rate each method produces. The chart below plots the year-one withdrawal rate for a 73-year-old retiree using each method’s canonical default. Numbers come from the source papers or IRS Publication 590-B.
A worked example: $50,000 year-one across five methods
The next table anchors all five methods to the same starting paycheck. Each row assumes the retiree wants exactly $50,000 of gross withdrawal in year one, using the method’s default rate. Portfolio sizes therefore differ by row. The year-two column then applies a shared shock: the portfolio falls 20 percent and consumer prices rise 3 percent.
| Method | Portfolio needed for $50k year one | Year-1 rule | Year-2 rule after 20 percent drop and 3 percent CPI | Year-2 withdrawal |
|---|---|---|---|---|
| Bengen constant real | $1,250,000 | 4.0 percent of day-one balance | Year-1 dollars plus 3 percent CPI, portfolio ignored | $51,500 |
| Constant percentage | $1,250,000 | 4.0 percent of current balance | 4.0 percent of $1,000,000 | $40,000 |
| RMD-based (age 73) | $1,325,000 | Balance divided by 26.5 | Balance $1,060,000 divided by age-74 divisor 25.5 | $41,569 |
| Guardrails 5.5 percent | $909,091 | 5.5 percent of day-one balance | CPI-adjusted $51,500 hits upper guardrail (7.08 percent). Cut 10 percent | $46,350 |
| Floor-and-ceiling 4 percent base | $1,250,000 | 4.0 percent of current balance, floor $45,000 | 4.0 percent of $1,000,000 rounds to $40,000, floor forces $45,000 | $45,000 |
The spread in year two runs from $40,000 to $51,500 on the same shock. That range is the honest measure of how much variability each method carries into a real household budget.
Historical portfolio survival: what the academic backtests actually say
Bengen’s original 1994 sample used rolling 30-year windows in U.S. stocks and intermediate government bonds since 1926. In that sample, a 4 percent initial withdrawal with CPI adjustments never exhausted a 50 to 75 percent equity portfolio over any 30-year window. The 1998 Trinity Study (Cooley, Hubbard, and Walz) confirmed the general shape at slightly lower success rates using corporate bonds.
The Guyton-Klinger 2006 paper reported that their guardrails method could support initial rates in the 5.0 to 6.5 percent range with comparable historical survival, because the cut rule truncated the worst sequences. Constant-percentage and RMD-based methods never exhaust by construction, but the income they deliver in bad decades can fall well below the household’s spending floor.
Later researchers including Michael Kitces and Wade Pfau flagged two limits on these numbers. The historical U.S. sample is small and lucky by global standards. Forward-looking safe rates depend on starting yields and equity valuations, both of which have varied widely over the last two decades. The SEC’s investor bulletin on the 4 percent rule makes the same point in plain language.
Behavioral difficulty: how much discipline each method demands
Behavioral load matters as much as arithmetic. The rules with the highest starting rate ask the most of the retiree in a bad year. That gap is worth naming explicitly at design time.
- Bengen 4 percent. Very low behavioral load. The dollar amount is fixed and inflation-adjusted. The retiree does not have to make a decision in a bear market.
- Constant percentage. Medium behavioral load. The retiree must accept a lower paycheck in the year following a market drop, but no discretionary decision is required.
- RMD-based. Low behavioral load. The IRS table dictates the divisor. The retiree looks up an age and does one division.
- Guardrails. High behavioral load. The retiree must actually execute the 10 percent cut in a losing year, which is exactly when it feels wrong.
- Floor-and-ceiling. Medium-high behavioral load. Defining the floor in advance is easy; sticking to the ceiling in a boom year is harder.
Interaction with Social Security and pensions
Any guaranteed income the household already receives reduces how aggressively the portfolio needs to respond to markets. Social Security and a defined-benefit pension both function as an inflation-sensitive spending floor beneath the portfolio methods above.
A retiree with $40,000 of combined Social Security and pension against $60,000 of desired spending only needs the portfolio to cover a $20,000 gap. The variability of a constant-percentage or guardrails withdrawal is easier to accept when the base groceries are covered by the check that arrives regardless of the S&P print.
The reverse is also true. A household with very little guaranteed income is exposed to the full year-to-year swing of whichever method it picks. In that case the Bengen rule’s rigidity buys a stable paycheck that dynamic methods do not offer. The Consumer Financial Protection Bureau’s before-you-claim tool is a plain-language starting point on how the Social Security piece changes this arithmetic.
Which method fits which retiree
Method choice rarely maps to one number. It maps to a small number of household facts that are usually known at retirement date.
- Bengen 4 percent fits a household that wants a stable real paycheck, has a small or absent guaranteed-income floor, and prefers not to make discretionary decisions in a bear market.
- Constant percentage fits a household with a solid Social Security or pension floor that can absorb a 20 to 30 percent income cut in a bad year without changing housing or health decisions.
- RMD-based fits a household that already draws from tax-deferred accounts under the same table, values arithmetic simplicity, and does not need above-4-percent income in the early years.
- Guardrails (Guyton-Klinger) fits a household that wants higher starting income, has the behavioral discipline to execute the cut in a losing year, and works with an advisor or written policy statement.
- Floor-and-ceiling fits a household that wants a bounded paycheck for budgeting, accepts that the floor is a policy commitment rather than a mathematical guarantee, and has a modest guaranteed-income base.
The RMD-based method deserves one extra note. Retirees already taking Required Minimum Distributions from traditional IRAs and 401(k)s can align their spending method with the divisor they already use, which the OPRS reference on the Uniform Lifetime Table for 2026 RMDs lays out in full.
Sources cited
- U.S. Securities and Exchange Commission, Investor.gov, Updated Investor Bulletin: The 4 Percent Rule and Other Strategies for Sustainable Withdrawals, the plain-language SEC overview of the safe-withdrawal-rate literature and its forward-looking limits.
- Internal Revenue Service, Publication 590-B, Distributions from Individual Retirement Arrangements (IRAs), the official source for the Uniform Lifetime Table divisors that anchor the RMD-based withdrawal method (age 73 divisor 26.5, age 74 divisor 25.5, age 80 divisor 20.2).
- Consumer Financial Protection Bureau, Planning for Retirement: Before You Claim, an interactive tool that shows how Social Security claiming age changes the monthly benefit that functions as the household’s guaranteed-income floor beneath any withdrawal method.