

Updated: August 16, 2026
OPRS may receive compensation when readers open an account through partner links on this page. Our analysis is based on independent research, BBB data, and IRS publications.
A retiree who reads the safe-withdrawal literature quickly meets the same question. If Bengen’s 4 percent rule leaves money on the table in most historical windows, is there a rule that starts higher and stays safe? The Guyton-Klinger guardrails method is the most-cited answer. It starts higher than 4 percent, then flexes the paycheck up or down when the portfolio drifts out of a defined band.
This page decodes the four decision rules, walks through a labeled worked example, and shows where the method fits and where it hurts. Every number comes from the source paper or from official retirement resources.
Where the method came from
Jonathan Guyton and William Klinger published the framework in the March 2006 issue of the Journal of Financial Planning. The paper was titled “Decision Rules and Maximum Initial Withdrawal Rates.” It extended earlier work Guyton had published in 2004 in the same journal.
The premise was direct. Bengen’s constant-real-dollar rule assumed the retiree would ignore market information after year one. Guyton and Klinger argued that a small, rule-based response to portfolio drift could support a higher starting rate over the same historical windows without raising failure risk.
They built the response as four discrete decision rules. Two describe how the retiree spends. Two describe how the retiree draws from the accounts. The rules run in a fixed sequence each year.
The four decision rules, in order
The rules are applied on the anniversary of the retirement date. The retiree computes the year’s proposed withdrawal, then walks the rules one at a time. Each rule either adjusts the withdrawal or leaves it unchanged before the next rule fires.
Rule 1. The portfolio-management rule
The portfolio-management rule is the accounting rule. It says which asset class the retiree draws from first. Cash is spent first. When cash runs out, the retiree sells whichever asset class had a positive return that year (equities in a good year, bonds in a bad equity year).
Excess gains in equities above a target allocation are moved to cash and bonds for the following year. The rule avoids selling a depressed asset class to fund a paycheck. That single sequencing choice does most of the work of protecting the portfolio from a bad-return sequence early in retirement.
Rule 2. The inflation rule
The inflation rule skips the annual CPI raise under one narrow condition. The condition is a losing year (portfolio return below zero) AND a current withdrawal rate above the initial rate. If either half is false, the CPI raise proceeds as usual.
The skipped raise is not made up in later years. The nominal withdrawal simply holds flat that year. Over a full retirement the rule triggers infrequently, but each trigger permanently lowers the base going forward, which conserves the portfolio without demanding a dollar cut the retiree can feel.
Rule 3. The capital-preservation rule (the upper guardrail)
The capital-preservation rule is the cut rule. If the current withdrawal rate rises more than 20 percent above the initial rate, the retiree cuts the withdrawal by 10 percent. A 5.5 percent starting rate has an upper guardrail at 6.6 percent (5.5 percent times 1.20).
The rule fires only when the current rate crosses the guardrail. It does not fire every bad year. It fires when a bad year has moved the ratio of withdrawal to portfolio far enough that the pace becomes hard to sustain.
Rule 4. The prosperity rule (the lower guardrail)
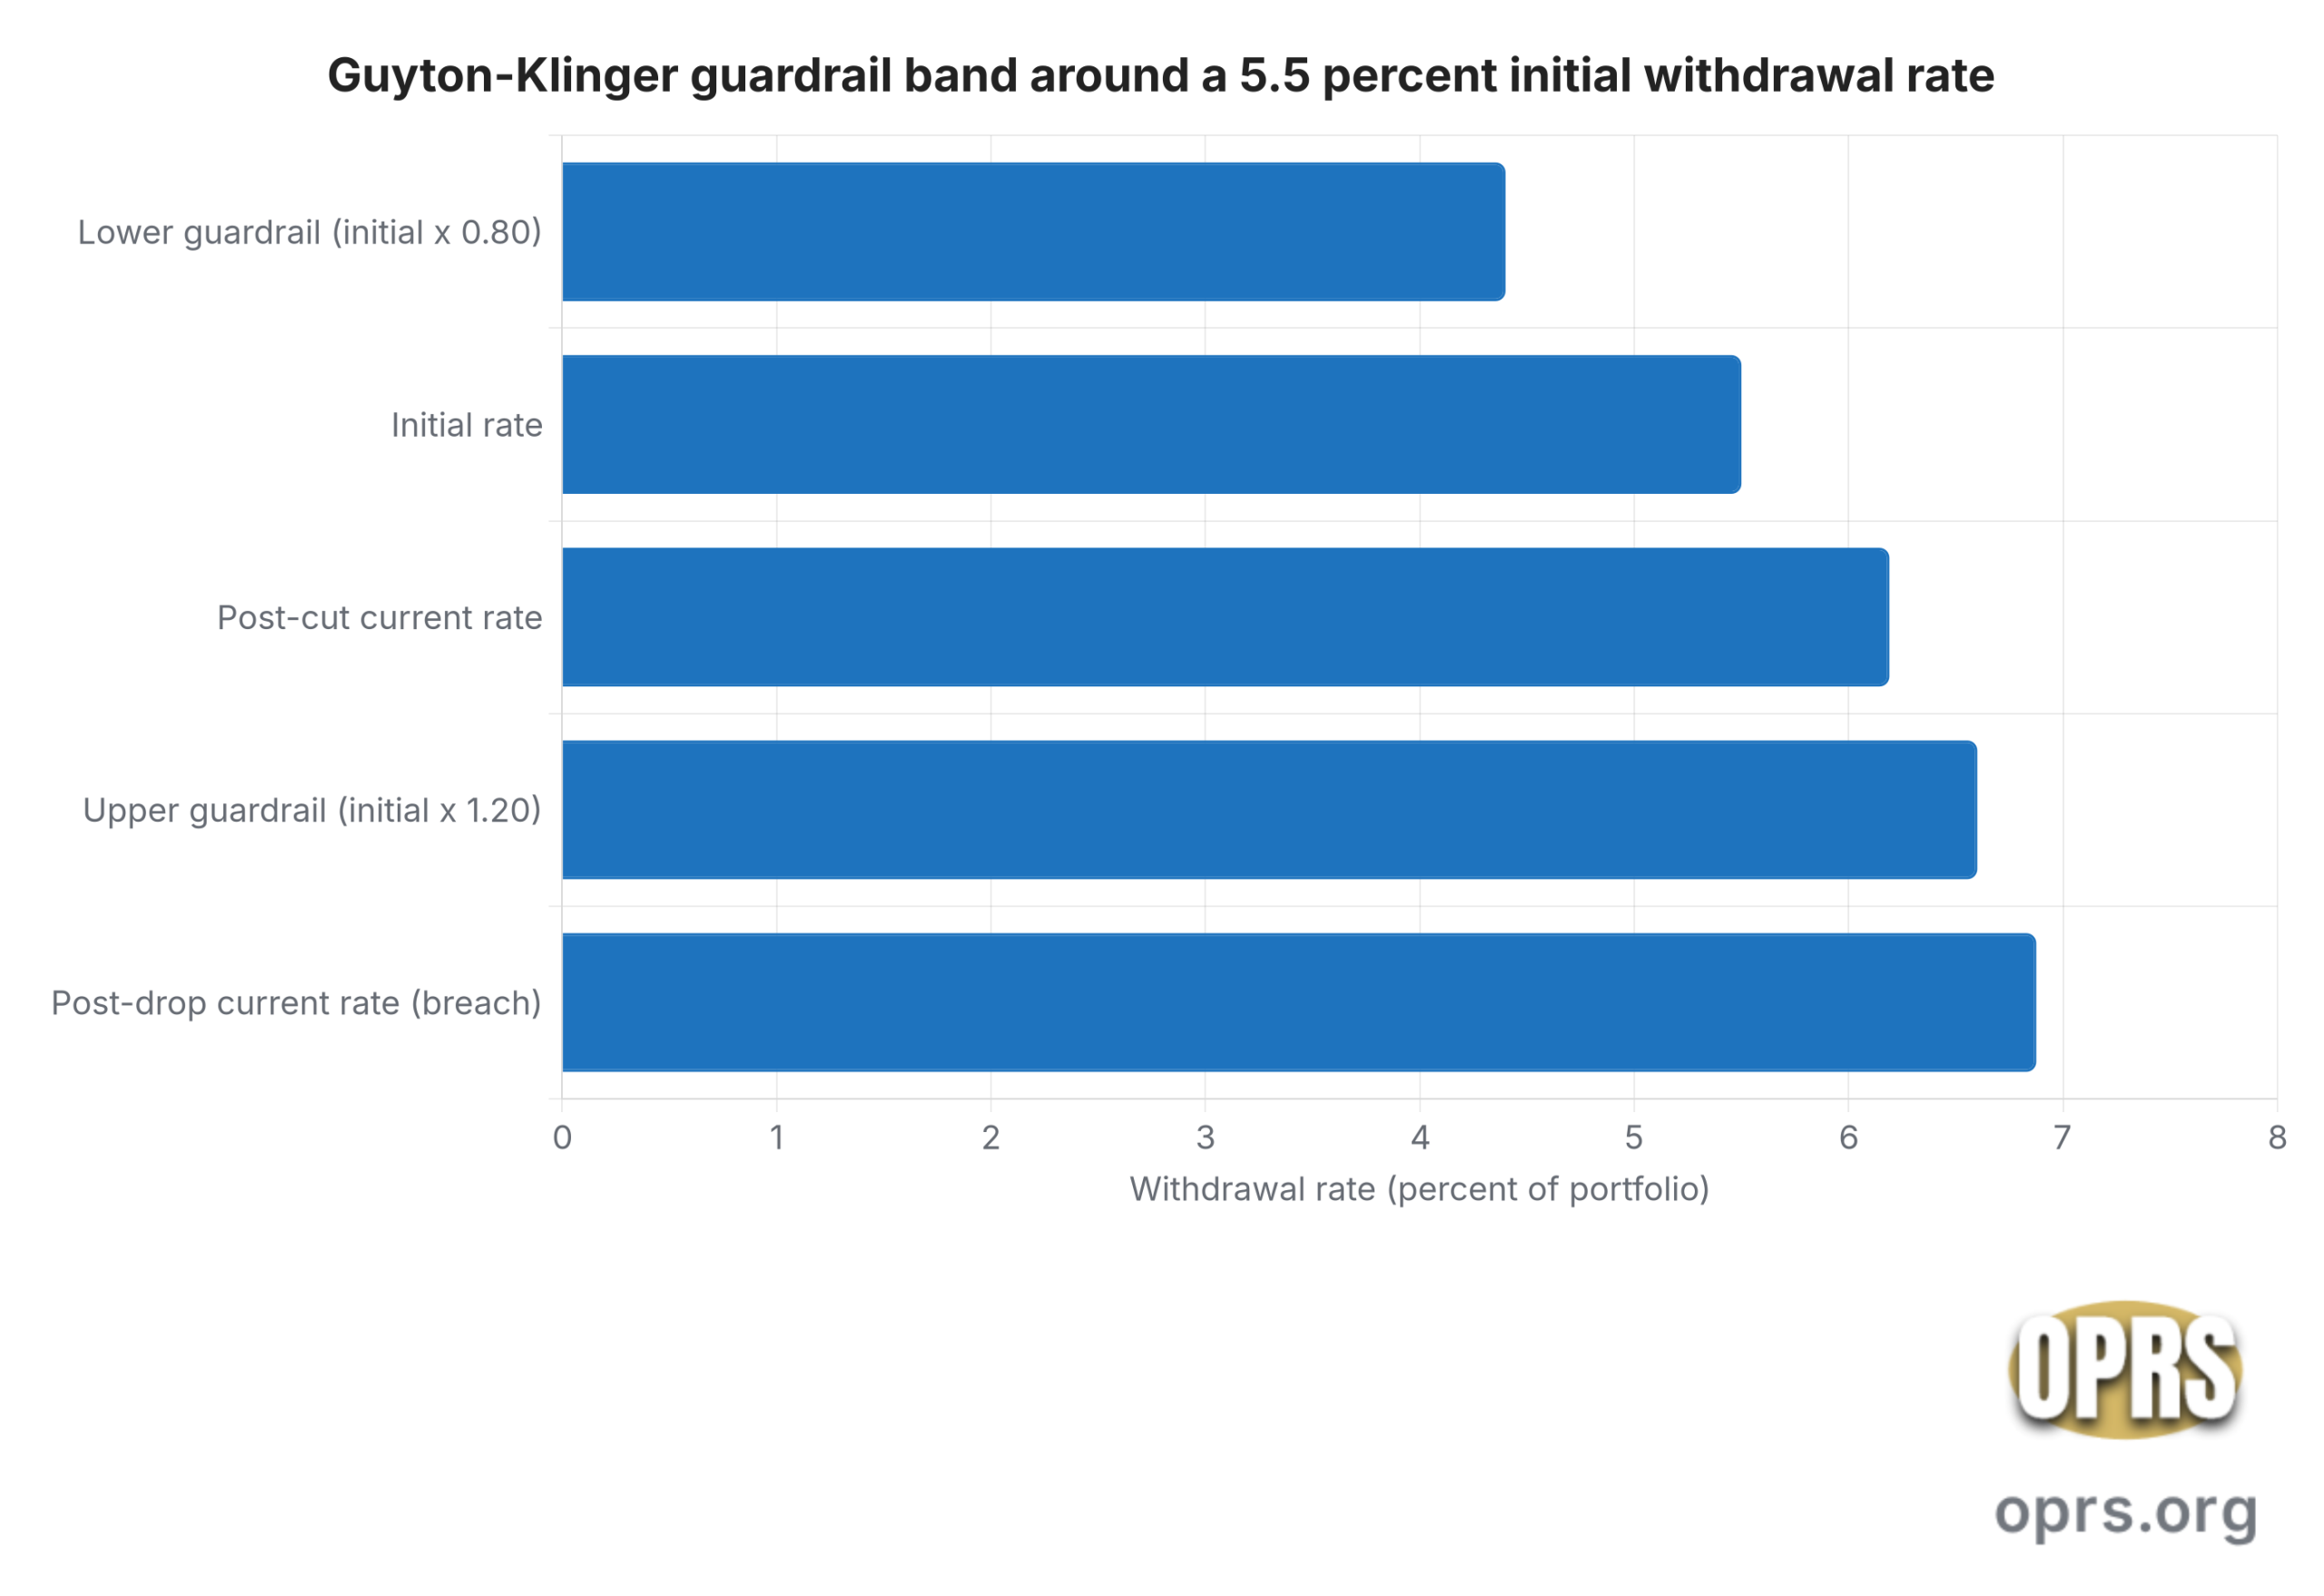
The prosperity rule is the raise rule. If the current withdrawal rate falls more than 20 percent below the initial rate, the retiree raises the withdrawal by 10 percent. A 5.5 percent starting rate has a lower guardrail at 4.4 percent (5.5 percent times 0.80).
The rule catches the opposite problem from Rule 3. A retiree whose portfolio has grown faster than spending will drift toward a very low withdrawal rate. Rule 4 lets that retiree enjoy the growth instead of dying with an unexplained pile of assets.
A labeled worked example: $500,000 at 5.5 percent
The mechanics are easier to see with real numbers. Assume a retiree starts with $500,000 and chooses a 5.5 percent initial rate. The year-one withdrawal is 5.5 percent of $500,000, or $27,500. The initial rate anchors both guardrails for the rest of retirement.
- Initial rate: 5.5 percent
- Upper guardrail (cut trigger): 5.5 percent times 1.20 = 6.6 percent
- Lower guardrail (raise trigger): 5.5 percent times 0.80 = 4.4 percent
Now assume the portfolio falls to $400,000 during year one. The retiree looks up the anniversary balance and computes the current withdrawal rate. The math is 27,500 divided by 400,000, which equals 6.875 percent.
That current rate (6.875 percent) is above the upper guardrail (6.6 percent). Rule 3 fires. The retiree cuts the withdrawal by 10 percent, from $27,500 to $24,750. The new current rate is 24,750 divided by 400,000, which equals 6.19 percent. That number is back inside the guardrail band, so no other cut is triggered until the next anniversary.
The rule set does not ask the retiree to predict markets. It asks for one arithmetic check on the anniversary date and one 10 percent adjustment if the check crosses a line.
The guardrail band on one chart
The chart below plots the five key percentages from the worked example above. All five numbers come from the article prose. No new data is introduced.
What the historical backtests showed
The 2006 paper ran the four rules on rolling historical windows using U.S. equity and bond returns. Guyton and Klinger reported that a 65 percent equity portfolio, at a 5.5 percent initial rate with the four rules active, produced a 99 percent success rate over 40-year retirement horizons in the sampled data.
The paper also tested higher initial rates. Rates around 6.0 to 6.5 percent stayed above 90 percent historical success in the same window, again under the four-rule policy. Rates without the rules fell below the Bengen baseline as expected.
Later research raised two limits worth naming. The historical sample is U.S. only and small by global standards. Forward-looking success rates depend on the starting yield and equity valuation on the retirement date, both of which vary widely. FINRA and the SEC’s investor education pages make the same point: past performance is not a promise of future results.
Guardrails vs constant-percentage vs RMD-based
Three flexible methods sit next to Guyton-Klinger in the withdrawal literature. Each responds to portfolio changes in a different way. The differences show up in what the paycheck feels like in a bad year.
The constant-percentage-of-portfolio method takes a fixed share (commonly 4 percent) of the current portfolio each year. The paycheck rises with the portfolio and falls with it in perfect lockstep. A 30 percent drop translates directly into a 30 percent paycheck cut. The portfolio cannot mathematically exhaust because every draw is proportional.
The RMD-based method uses the IRS Uniform Lifetime Table divisor for the retiree’s age, applied to the prior-year-end balance. At age 73 the divisor is 26.5, which gives a 3.77 percent starting rate. The rate rises with age by design. Like the constant-percentage method, the portfolio cannot exhaust because each divisor is finite.
Guyton-Klinger sits between these two poles. It starts higher than either flexible method (often 5.0 to 5.5 percent) but caps the response with the 10 percent cut. A retiree who wants a full head-to-head of the five most-cited methods can read the OPRS reference on dynamic withdrawal rules versus the fixed 4 percent rate.
The behavioral discipline the method actually requires
Guyton-Klinger’s arithmetic is simple. The behavioral requirement is not. The cut rule fires exactly when it feels wrong, which is after a losing year, when the household is already anxious.
The cut is 10 percent of the withdrawal, not of the portfolio. A retiree drawing $27,500 who accepts the cut sees the paycheck drop to $24,750 for the year. That is a $2,750 change to a household budget, at the same moment the news cycle is loudest about the market.
The academic backtests assume the retiree executes the cut every time. In practice, a written spending policy statement (often signed with a financial advisor before retirement) is what keeps the rule enforceable. Households that do not commit the rule to paper tend to skip the cut, which is the exact behavior the historical success rates do not price.
How Social Security and pensions change the picture
Guaranteed income changes the arithmetic in a useful way. Social Security and any defined-benefit pension both function as an inflation-sensitive spending floor beneath the portfolio. Whatever the guardrails method does to the portfolio-funded paycheck, the floor stays the same.
A household with $40,000 of combined Social Security and pension against $65,000 of desired spending only needs the portfolio to cover a $25,000 gap. A 10 percent guardrail cut on that portfolio slice moves total household income by roughly 4 percent, not by 10 percent. The behavioral load falls with it.
The reverse is also true. A household with almost no guaranteed income absorbs the full 10 percent cut inside its total budget. In that case a stable-paycheck method (Bengen constant real) may be a better psychological fit even at a lower starting rate. The Consumer Financial Protection Bureau’s before-you-claim tool is a plain-language starting point for the Social Security piece of that math.
When Guyton-Klinger fits and when it does not
The method does not fit every retiree. A quick match test on three household facts usually settles the question.
- Guaranteed-income floor. A household with Social Security plus pension covering most of essential spending can absorb guardrails cuts without pain. A household without that floor cannot.
- Discretion split. A household with a large discretionary-spending share (travel, gifts, hobbies) has natural room to absorb a 10 percent cut. A household spending mostly on housing, health, and utilities does not.
- Written policy. A household that will actually cut in a losing year is a fit. A household that treats the withdrawal number as fixed once retirement starts is not.
The method is also silent on tax placement. A retiree drawing from a taxable brokerage account, a traditional IRA, and a Roth IRA together will get very different tax outcomes depending on the sequencing, even with the guardrails rules held constant. Guyton-Klinger sets the withdrawal amount. It does not answer which account the dollars come from.
Sources cited
- U.S. Securities and Exchange Commission, Investor.gov, Investment Products, the plain-language federal reference on how the asset classes named in the Guyton-Klinger portfolio-management rule (stocks, bonds, cash equivalents) are defined and how their return profiles differ.
- Consumer Financial Protection Bureau, Planning for Retirement: Before You Claim, the official interactive tool that shows how the Social Security claiming age changes the monthly benefit that functions as the guaranteed-income floor beneath a Guyton-Klinger portfolio.
- Financial Industry Regulatory Authority, Investor Education, Retirement Accounts, the FINRA overview of the tax-advantaged account types (IRA, 401(k), 403(b)) whose portfolio balances feed the Guyton-Klinger anniversary calculation.