

Updated: August 17, 2026
OPRS may receive compensation when readers open an account through partner links on this page. Our analysis is based on independent research, BBB data, and IRS publications.
Two retirees can hold the same portfolio, earn the same long-run average return, and end retirement in very different places. The difference is not luck alone. It is the order in which the returns arrive, combined with the fact that both retirees are pulling a paycheck out of the account every year. Financial planners call it sequence-of-returns risk, or SORR, and it is the single most under-explained mechanic in retirement withdrawal planning.
This page walks through the intuition, a labeled worked example with real math, the fragile decade around the retirement date, and five mitigation strategies that come out of the academic literature. No forecasts, no products, no fear framing. The point is that sequence risk is a mechanical property of the math, not a market prediction, and the mitigations are equally mechanical.
The intuition: order matters when you are withdrawing
In the accumulation years, when you are only adding to the portfolio, the order of returns is close to irrelevant. What matters is the long-run compounded rate. A bad year followed by a good year and a good year followed by a bad year both end at the same place, because nothing was being pulled out along the way.
Retirement flips that math. You are now pulling money out at the same time the market is moving up and down. A large loss in year one shrinks the base. Every dollar you then withdraw comes out of an already-smaller pot. When the market recovers, the recovery gain applies to a base that was permanently reduced by the combination of the loss and the withdrawal.
That single asymmetry is the whole story. You cannot get the withdrawn dollars back. The base is permanently smaller. Every subsequent gain is smaller in absolute dollars than it would have been. Over a thirty-year retirement, small losses compounded against smaller bases add up to portfolio exhaustion for one retiree and portfolio surplus for another, even when the average return over the whole period is identical.
A labeled worked example: identical average, opposite outcomes
Consider two retirees, each starting with a $100,000 portfolio at age 65 and withdrawing $7,000 per year at the end of each year. To keep the mechanics visible, assume constant real dollars (no inflation adjustment, no CPI drift). Both retirees hold the same investment mix over thirty years. The only difference is the year the bad return shows up.
- Portfolio A earns minus 30 percent in year one, then plus 8 percent every year from year two through year thirty.
- Portfolio B earns plus 8 percent every year from year one through year twenty-nine, then minus 30 percent in year thirty.
Both sequences contain exactly one loss of 30 percent and twenty-nine gains of 8 percent. The arithmetic mean of the two return streams is the same. The geometric mean is the same, roughly 6.45 percent per year. The only thing that differs is when the bad year arrives.
Portfolio A finishes year one at $63,000, because the initial $100,000 lost 30 percent (to $70,000) and then paid out the $7,000 withdrawal. From that lower base, 8 percent per year cannot outrun the $7,000 draw for long. The account drops through the teens by year fifteen and exhausts in year eighteen, twelve years short of a thirty-year retirement.
Portfolio B compounds at 8 percent while paying out $7,000 for twenty-nine years, ending year twenty-nine at roughly $204,000. The final year takes the 30 percent hit and the $7,000 withdrawal, closing at about $136,000. Same returns, same withdrawals, same average. One retiree runs out at year eighteen. The other still has $136,000 at year thirty.
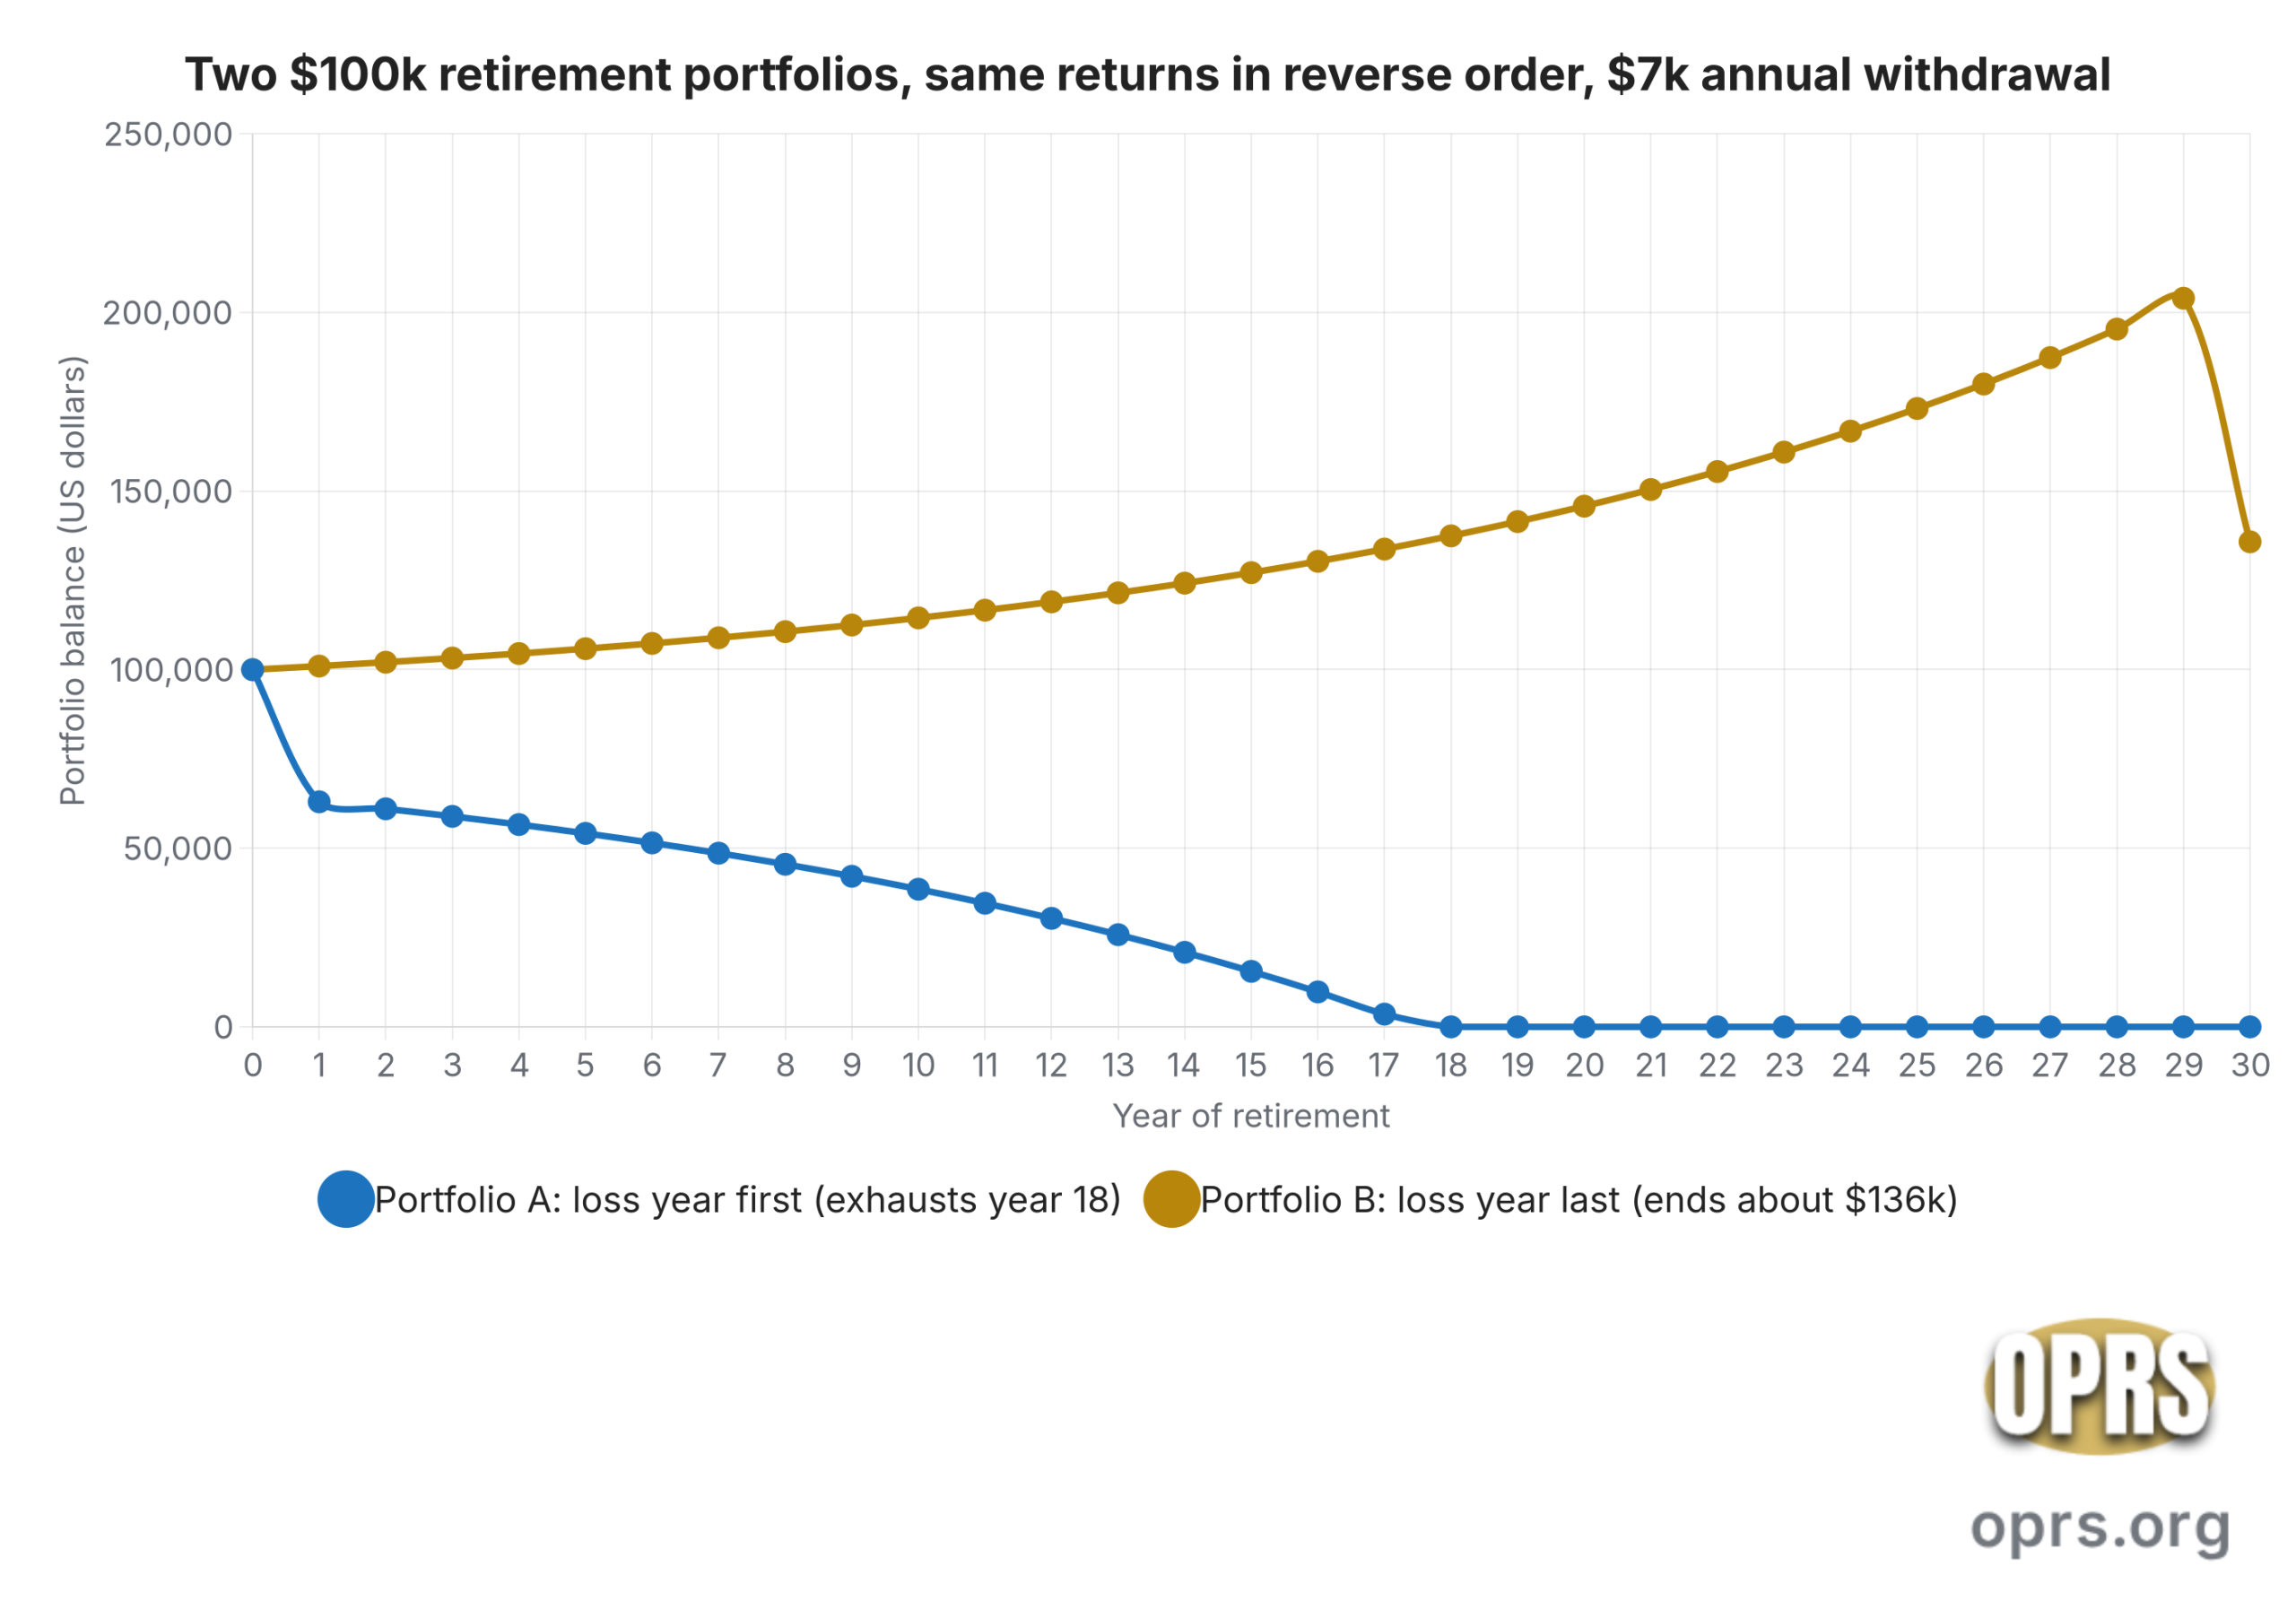
The gap is not a rounding error or a modeling artifact. It is the mechanical result of a large loss combining with an active withdrawal against a fixed dollar amount. Nothing about the underlying investment strategy is different. Only the calendar changed.
The fragile decade: the five years before and after retirement
Sequence risk is not uniform across a retirement. The mechanics of the worked example above make clear why. A bad year in year one hurts far more than the same bad year in year twenty, because the retiree has twenty-nine years of withdrawals still coming against the smaller base.
Academics and financial planners call the danger window the fragile decade, sometimes the retirement red zone. It runs roughly from five years before the planned retirement date to five years after. A large loss inside that window has almost the entire withdrawal schedule ahead of it. The same loss ten years later has half or less of the retirement to inflict damage across.
The pre-retirement half of the window matters because most retirees have their highest career balance in the five years before they leave work. A bear market in that period can force a delay of the retirement date, a lower starting withdrawal, or both. The post-retirement half matters because withdrawals are now permanent draws against the base.
Mitigation 1: the rising equity glidepath
The traditional advice was that stock exposure should fall steadily through retirement. Michael Kitces and Wade Pfau published research in 2014 arguing the opposite. Their finding: a portfolio that starts with a lower equity allocation at the retirement date and slowly raises equities over the next ten to twenty years posted better outcomes across historical windows. It beat both a flat allocation and a steadily declining one.
The reason is direct. A low equity allocation on the retirement date reduces the size of any early loss. Raising equities later in retirement, once the fragile decade has passed, restores the growth engine at the point when a bad year does less damage. The glidepath is one shape. The mechanic is dedicated protection during the years the math is most sensitive.
Mitigation 2: the bond tent
The bond tent is a variation on the same idea. Instead of a permanent glidepath, the retiree temporarily raises the fixed-income allocation in the years immediately around retirement, then gradually lowers it back down. The shape of the allocation over time looks like a tent, with the peak bond exposure at retirement.
A bond tent typically holds five to ten years of expected spending in bonds and cash during the peak window. Once the fragile decade has passed, the allocation drifts back to a more balanced mix. The bond tent buys sequence protection without permanently sacrificing the long-run growth needed to fund a thirty-year retirement.
Mitigation 3: the short-term cash bucket
The simplest mitigation is a defined pot of near-cash reserved for near-term spending. Hold one to three years of grocery, utility, and health-premium money in short Treasury bills or an FDIC savings account. That reserve removes the pressure to sell equities to fund the next paycheck in a bad market year.
That single fact removes the forced-sale trigger that turns a paper loss into a permanent one. The related three-bucket design formalizes this into a rules-based structure that separates short, medium, and long horizons. See the bucket strategy for retirement income page for the full mechanics and refill logic.
Mitigation 4: guardrails withdrawal that flexes with the market
Constant-real-dollar withdrawal rules like Bengen’s 4 percent assume the retiree ignores market information after year one. Guardrails methods do the opposite. Jonathan Guyton and William Klinger published a decision-rule framework in 2006. It lowers the paycheck when the withdrawal rate drifts too high above the initial rate, and raises it when the rate drifts too far below.
A guardrails schedule shifts some of the sequence risk from the portfolio to the retiree’s spending. That trade is often worth taking, because a 10 percent cut to a discretionary spending line is far less disruptive than portfolio exhaustion at age 83. See the Guyton-Klinger guardrails method page for the four rules and a labeled example.
Mitigation 5: delayed Social Security as a longevity and sequence hedge
Every year of delay past full retirement age raises the Social Security benefit by 8 percent up to age 70, as delayed retirement credits. The larger benefit is a permanent, inflation-adjusted income stream backed by the federal government. In sequence-risk terms, that permanent income reduces how much the portfolio has to fund out of its own base.
A retiree who delays Social Security to age 70 pulls more from the portfolio in the four to five years before that switch. The trade is a higher early portfolio draw against a lower lifetime portfolio dependence. The Consumer Financial Protection Bureau’s claim-timing tool models the tradeoff directly for a household’s own numbers. Delayed Social Security also acts as late-life longevity insurance, because the higher benefit continues for as long as the retiree lives.
The behavioral trap: panic-selling makes sequence risk worse
Every mitigation above assumes the retiree stays invested through the bad year. That assumption is not automatic. Studies of retiree behavior during 2008 and 2020 consistently found that a meaningful share of households sold equities near the bottom, locking in the paper loss and missing the recovery. That single decision converts a manageable sequence problem into a permanent one.
The Financial Industry Regulatory Authority and the SEC’s Office of Investor Education both flag panic reactions to short-term volatility as one of the most damaging errors a retiree can make. The advice is not to ignore risk. The advice is to build the plan on paper before the bad year, so the response in the moment is a rule to follow rather than a decision to make under pressure.
A written plan that already contains a cash bucket, a bond tent or glidepath, and a guardrails withdrawal rule tells the retiree exactly what to do when the market drops 30 percent. The plan is boring. It is also the largest single behavioral defense against sequence risk that exists.
What the honest math will not tell you
None of the mitigations above eliminates sequence risk. Each of them buys some protection at some cost. A rising equity glidepath is difficult for a retiree who cannot stomach raising stock exposure in the middle of retirement. A bond tent underperforms in a long bull run. A cash bucket earns less than the equities it replaces. A guardrails method requires the household to accept a real spending cut in some years.
The right question is not which mitigation is perfect. The right question is which combination fits the household’s spending floor, other income sources, and behavioral tolerance for volatility. That combination is best built with a fee-only fiduciary planner before the retirement date, using the household’s own numbers rather than a rule of thumb.
Sources cited
- SEC Office of Investor Education and Advocacy, Investor Bulletin on retirement account distributions and rollovers: investor.gov bulletin on retirement distributions.
- FINRA investor education on retirement accounts and volatility: finra.org retirement accounts hub.
- Consumer Financial Protection Bureau, Planning for Retirement claim-timing tool: consumerfinance.gov before-you-claim tool.
- Social Security Administration, Delayed Retirement Credits: ssa.gov delayed retirement credits.